Data and Maps
Data visualization is one of the most powerful tools for making making abstract policy tangible. Below is a selection of data projects I've built for government, nonprofit, and advocacy clients to make their case to funders and share their policy with communities.

Need Mapping for Grant Applications
Gem City Kitties Low-Cost Veterinary Clinic
This map was created to support grant applications for a low-cost veterinary clinic serving the Dayton area. Each dot represents a client household, overlaid on a basemap showing low-income households by ZIP code.
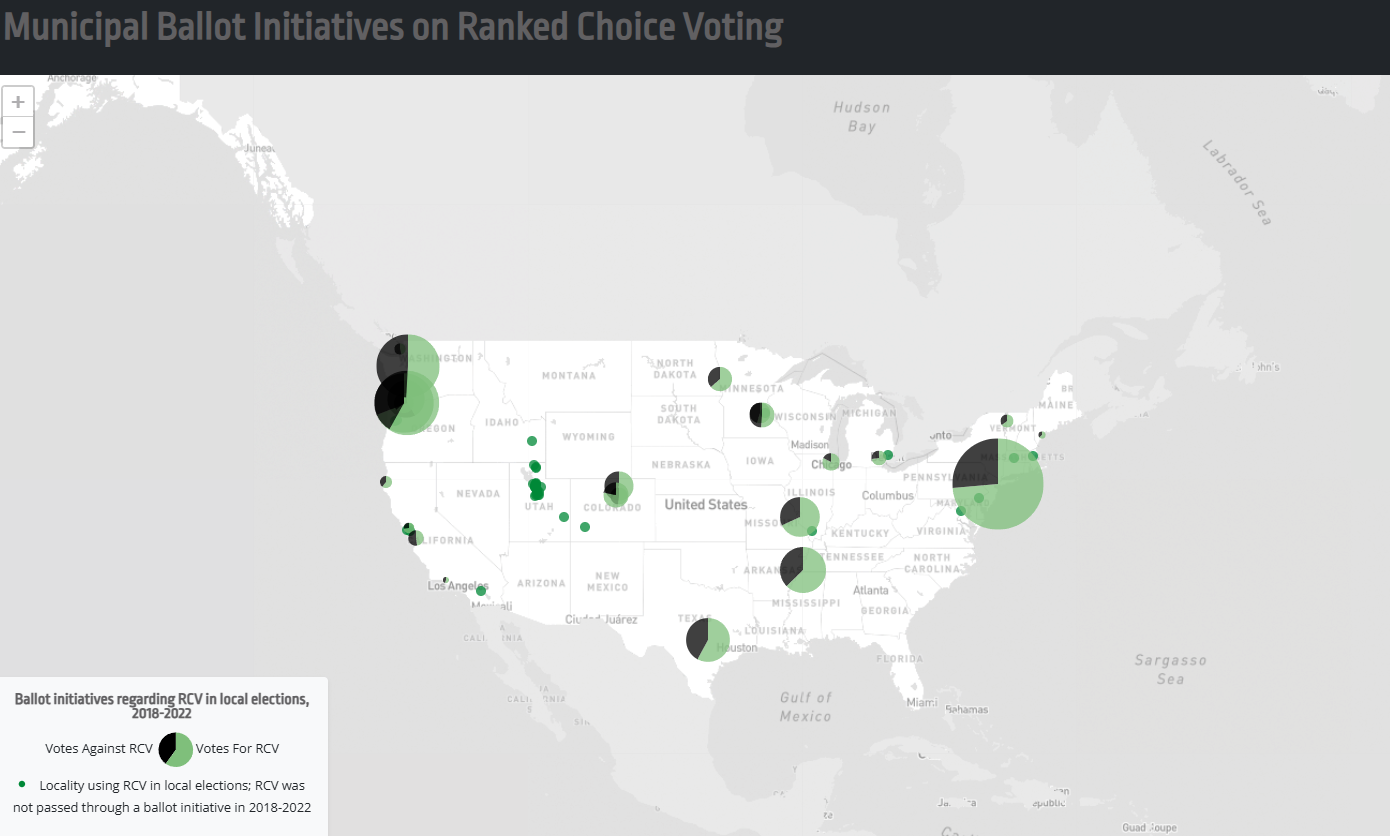
The Success of RCV in Ballot Initiatives
This project demonstrates the success of Ranked Choice Voting in local ballot initiatives. It was designed as an advocacy tool — giving organizers a clear, shareable way to demonstrate momentum to legislators and press.

Police Pursuits Proposal
Independent Research Project
This project maps traffic fatalities involving police pursuits using NHTSA data, and proposes geospatial analysis as a tool for further study of pursuit-related fatalities. It was created as a course project but reflects the kind of policy-adjacent research I'm drawn to: using publicly available data to surface patterns that matter for public safety decision-making.
Map created QGIS 3.22.5 for a course project. The basemap uses OpenStreetMap and Census TIGER data. Poster created in Adobe Illustrator.

City Capital Improvements Plan Map
Annual story map of upcoming Capital Improvements Projects. I serve in a contributor role to this annual project translating the city’s infrastructure budget to a public-facing format.